Blog
dNBR vs RdNBR: how to tell them apart
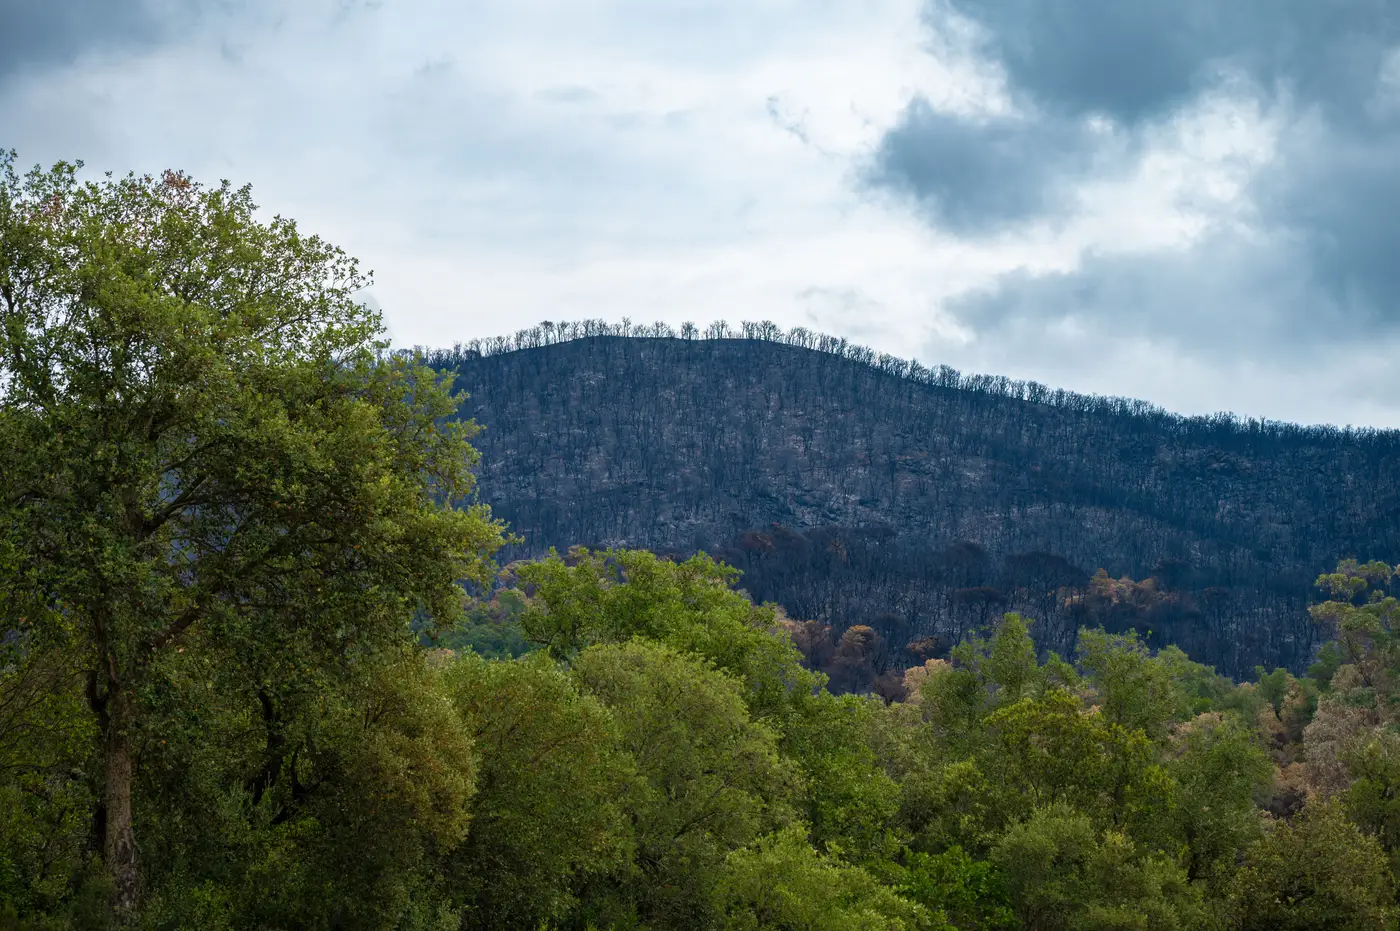
Two analysts can run the same post-fire imagery through two different formulas and land on two different severity maps for the same acres burned. Most of the time that's a dNBR vs RdNBR mismatch, and it's worth sorting out before either map goes into a planning packet.
What each index is doing
NBR itself is a ratio of near-infrared to shortwave-infrared reflectance, the same SWIR contrast that makes burned ground read differently from green canopy or bare soil. Both severity indices start from a pre-fire vs post-fire NBR comparison. They just handle that comparison differently.
Subtract post-fire NBR from pre-fire NBR and you get dNBR, the differenced normalized burn ratio. Bigger drop, more severe burn, in theory.
The catch shows up on edges and understory burns. A grass flat that was already sparse before the fire can't drop its NBR much, because there wasn't much canopy signal to lose in the first place. Dense timber can drop a lot from a moderate-severity surface fire, just because the pre-fire NBR started so high. dNBR reads both of those through the same flat scale, so what gets flattened is how much canopy was there to burn in the first place.
RdNBR, the relative burn severity index, corrects for that by dividing dNBR by the square root of the absolute value of pre-fire NBR. That puts the change in proportion to what was standing there before ignition. A stand that starts thin and a stand that starts thick get graded against their own baseline instead of a shared yardstick.
When the extra step is worth it
If your perimeter sits inside one cover type, a single even-aged conifer stand with no real understory variation, dNBR alone usually gets you a usable severity grade without the extra division step. Most published severity thresholds were built and validated around dNBR, so sticking with it keeps your classes comparable to other agencies' post-fire assessments using the same breakpoints.
RdNBR earns its keep on mixed terrain. Chaparral next to oak woodland, a scar that runs from dense fir into open sage, anywhere the pre-fire vegetation density swings hard across the footprint. That's most of the fires an intel officer works. The relative index keeps a sparse shrub flat from reading as low severity just because it had nowhere left to drop from, and keeps a lush riparian strip from reading as catastrophic when the burn there was moderate.
The practical tell, when a severity map looks wrong: check what was growing there before the fire. If the high-severity polygons line up suspiciously well with where the densest canopy used to be, and not with where the fire ran hottest, you're probably looking at dNBR output on variable vegetation. Worth rerunning as RdNBR before it goes into a BAER report or a rehab prioritization.
Picking the pre-fire and post-fire scenes
Both indices depend on the image pair feeding them. The pre-fire NBR scene needs to sit near peak green-up, when canopy cover is at its fullest, since a winter pass already reads low before any fire ever touches the ground. The post-fire scene works best once smoke has cleared and before regrowth starts pulling the signal back toward green, so haze from the fire itself doesn't get counted as burn. Get that timing wrong in either direction and the index you pick afterward won't fix it.
None of this requires rebuilding the workflow fire by fire from scratch. A daily severity layer built on the same SWIR-based math, already split into active front and burned footprint, saves that index-selection argument for office hours instead of an active incident.
If you'd rather see that severity grading land on your desk already run, that's the whole point of Fire Perimeter Map.