Blog
What is a perimeter confidence level in fire mapping?
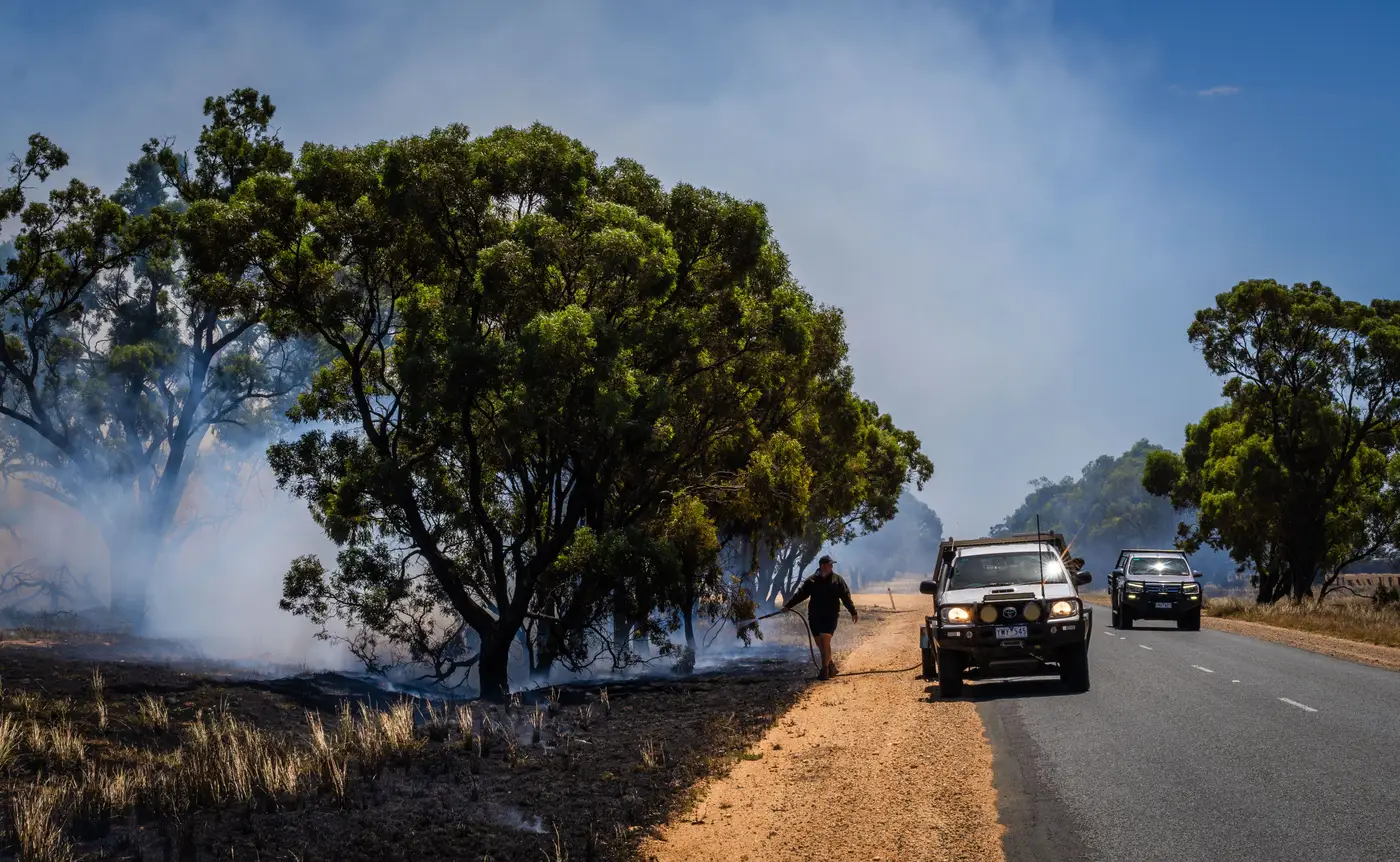
If you've sat in a planning meeting and heard someone ask "is that line confidence or is that fiction," you already know why this term matters. A perimeter confidence level is the agency's own rating of how sure the mapping source is about where the fire edge actually sits, as opposed to where a model thinks it probably sits.
It shows up in different places depending on the shop. Some incident GIS units tag it directly on the shapefile attribute table (high, medium, low). Others just describe it in the 209 narrative or in the map legend as a dashed versus solid line. Either way, the point is the same: not every line on a perimeter map was observed. Some were inferred, and the crew on the ground needs to know which is which before they stage resources against it.
Where the confidence rating comes from
A perimeter gets its confidence rating from how it was built, not from a formula applied after the fact.
A heat-detected or infrared-mapped edge, flown by a fixed-wing IR platform or pulled from a recent satellite pass, earns high confidence because a sensor saw thermal activity or scar at that location at that time. The interpreter drawing the line is tracing something real.
A modeled edge is different. Fire behavior software like FARSITE or FSPro projects where the fire is likely to be based on fuel model, slope, wind, and fire history, often to fill the gap between the last flight and right now. It's a reasonable estimate built from good inputs, and it's still a guess. That distinction, modeled versus mapped, is the one that matters most when you're deciding how far to pull resources back from an edge or how tight to draw an evacuation line.
Low confidence usually means stale data. A perimeter from 18 hours ago on a fire that's actively running is low confidence no matter how precisely it was mapped at the time, because fire behavior has probably outrun it.
Reading the high confidence line in the field
On the ops side, the practical test is simple: would you stake a crew's safety zone on this line, or would you want eyes on it first?
A high confidence line, fresh off an IR flight or a same-day satellite pass with clear fire activity, is something division supervisors can plan against with reasonable trust. It's still not gospel. Smoke, unburned islands inside the perimeter, and spot fires outside it don't always show up cleanly even on a good pass. But it's the closest thing to ground truth the GIS unit has without boots physically walking the line.
A modeled or low-confidence line belongs in the strategic conversation, not the tactical one. It's useful for the planning section thinking about tomorrow's resource order or for public information deciding how wide to draw a pre-evacuation zone. It's a bad thing to hand a strike team leader as "the perimeter" without a caveat.
Most incidents end up running both at once: a high confidence mapped edge from this morning's flight, stitched to a modeled projection for the hours since, with the seam marked so nobody downstream mistakes one for the other. That seam is the whole job. Lose track of it and your perimeter map quietly turns into a forecast wearing a mapped perimeter's clothes.
Why the gap keeps showing up
The honest reason low confidence perimeters exist at all is cadence. A single IR flight can't be airborne every hour, and a lot of fires run faster than the next flight window. Wide-swath satellite coverage closes part of that gap by giving the GIS unit a fresh heat-and-burn read once a day without waiting on aircraft availability, which keeps the "last known good" line closer to current and shortens how far the modeled portion has to stretch to fill in.
Fire Perimeter Map is built around exactly that gap, splitting active fire front from already-burned area using daily satellite passes so the perimeter you're briefing off is mapped, not projected.
If your situation unit is tired of explaining which part of the line is real, it might be worth a look.